65% Occupancy in 20 Days: Success during off season with Airbnb Consultant Strategies
- Minakshi Dahiya

- 3 days ago
- 5 min read
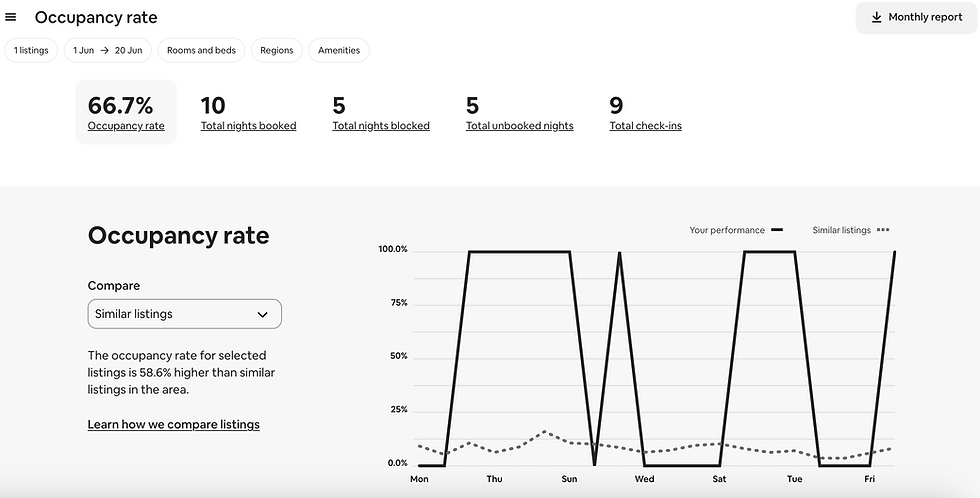
A Superhost's Udaipur listing had zero booked nights in May. Twenty days after we started working together, his two-listing portfolio was running at a combined 65% occupancy, nearly 9X the off-season market average, during the exact months most hosts in this city have quietly given up on.
The Season Everyone Writes Off
Ask any Udaipur host what May to September feels like, and you'll hear the same answer: dead season. The heat is punishing, the monsoon keeps travelers away, the wedding crowds that fill the city's calendars all winter simply aren't there. Right now, the average Airbnb occupancy rate across Udaipur sits at roughly 7.5%.
Most hosts look at that number, accept it, and wait for October.
This is the story of a host who didn't.
The Call
He reached out to me at the end of May, already a Superhost, which tells you something. This wasn't a host with a bad listing or no track record. This was someone who'd already built a guest experience good enough to earn Airbnb's top badge, and was still watching his calendar sit empty.
He asked me the same question I hear from almost every host who messages me during the off-season: can anything actually be done right now, or do I just wait it out?
I love this exact kind of challenges. Off-season strategy is where the real strategic creative thinking happens, anyone can fill a calendar in December.
The Baseline: What May Looked Like
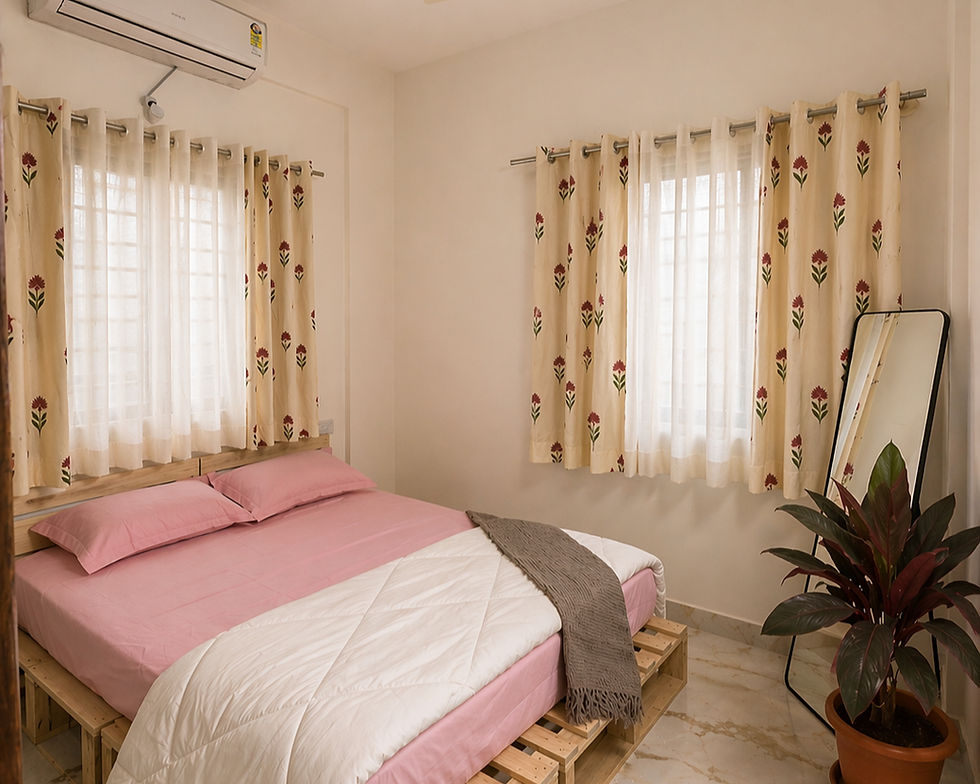
Across his two listings, a 2BHK apartment and a penthouse, here's where things stood before we started:
Listing | May Occupancy | Nights Booked | Check-ins | vs. Similar Listings |
2BHK Apartment | 0.0% | 0 | 0 | — |
Penthouse | 25.0% | 6 | 4 | +17.0% |
Combined | 11.5% | 3 (avg) | 2 (avg) | +4.2% |
The Penthouse was already outperforming nearby listings, proof the fundamentals weren't all broken. But the 2BHK hadn't had a single guest the entire month, and the combined occupancy across both properties was actually declining, down half a point from the month before. Off-season, for him, wasn't stable. It was slowly getting worse.
Off-Season Doesn't Mean No Demand. It Means Different Demand.
Here's the mistake almost every host makes with the same logic: treating May–September as one long dead zone, instead of a season with its own, smaller, different, pool of travelers.
Monsoon long-stayers escaping the season elsewhere. Regional travelers avoiding peak-season crowds and peak-season prices. Guests who don't plan their trips around the wedding calendar at all.
The 7.5% market average isn't a hard ceiling on what's possible. It's simply where most listings settle when nobody adjusts anything for the season they're actually in.
What Changed, Starting June 1
Four things moved together from day one: off-season pricing recalibration, a full listing optimization pass on both properties, demand-driver targeting toward monsoon long-stays and regional travellers instead of a wedding-season crowd that simply isn't in the market right now, and a minimum-stay and calendar strategy rebuilt around how off-season guests actually book. No new furniture, no new photography budget, no paid ads, just a strategy matched to the season that was actually happening.
The Numbers: First 20 Days of June
(This is real-time data through June 20, there are still 10 days left in the month.)
Listing | June Occupancy (Day 1–20) | Nights Booked | vs. Off-Season Market Avg (~7.5%) |
2BHK Apartment | 55.0% | 11 / 20 | more than 7X |
Penthouse | 75.0% | 15 / 20 | exactly 10X |
Combined | 65.0% | 26 / 40 | nearly 9X |
One detail worth pulling out: of the Penthouse's 15 booked nights, 10 came through Airbnb and 5 were booked directly, outside the platform entirely. That's not a fluke of Airbnb's search algorithm, it's real off-season demand for the property itself, which is exactly the kind of demand an off-season strategy should be built to capture.
The listing that had zero booked nights in May is now running at 55.0% occupancy. The Penthouse went from 25.0% to 75.0% exactly three times its own May rate, and sitting at a clean 10X the off-season market average.


May vs. June, Side by Side
May (Baseline) | June (Day 1–20) | |
2BHK Apartment | 0.0% | 55.0% |
Penthouse | 25.0% | 75.0% |
Combined | 11.5% | 65.0% |
Udaipur Off-Season Market Average | ~7.5% | ~7.5% |
And the Earnings Mirror the Same Story
Occupancy isn't the only number that moved. Measured against the same month last year, which controls for seasonality, since June is being compared to June, this listing's earnings are up 838% year-over-year. And that's with 10 days of the month still left to add to it.

Takeaways for Every Off-Season Host
Hosting during the off-season can be a unique challenge, but it also provides an excellent opportunity to learn and improve.
By applying these lessons, off-season hosts can create memorable experiences for their guests and ensure a successful transition into the peak season.
1. The market average isn't your ceiling. It's the average of hosts who didn't adjust anything for the season.
2. A "dead" listing usually isn't dead. It's misaligned with who's actually traveling right now, not who travelled six months ago.
3. Off-season strategy is not "lower the price and wait." It's pricing, positioning, minimum stays, and demand-targeting, rebuilt for the season you're actually in.
4. Your dashboard doesn't always show your full picture. Direct bookings count too, and they're proof of real demand, not platform luck.
5. You don't need to wait out an entire season to know if a strategy works. Twenty days was enough to see the shift here, in occupancy and in earnings.
6. Superhost status gets you the badge. Strategy gets you the booking. They are not the same thing, and one doesn't guarantee the other.
Is Your Calendar Sitting Out the Off-Season?
If your bookings have gone quiet and you've decided that's just what off-season looks like that's a choice, not a fact. Markets vary, properties vary, and not every listing will see these exact numbers. But every listing deserves a strategy built on its actual season, not a generic one borrowed from peak months.
That's exactly what I help Indian hosts build.
Data in this case study reflects the client's verified Airbnb host dashboard, direct booking records, and earnings dashboard for May 1–31, 2026, June 1–20, 2026, and June 2025 (year-over-year comparison).


Comments